

J.F.Drew © 2000-2017


Mobile menus
VK5DJ
Deviation meter
A project by Brian VK5VI and John VK5DJ
This project is primarily for those who need to set up repeater levels but it would also be of value for those who like to check and adjust their FM transceivers.
The meter is designed to work in association with a scanner. Thanks to Brian VK5VI who provided the motivation for this and the know how on the amplifier detector part of things and for his skilful use of a program to design the boards to fit a minimum space. My role was to design and build the PIC portion.
Click circuit for larger version. A zipped file of all diagrams, hex code and construction articles is here.
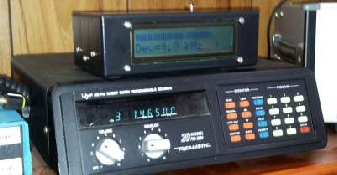
Top view of modulation meter. Note mute connection in this prototype with wire going to pin 1 of the PIC , see board layout photo for correct wiring.
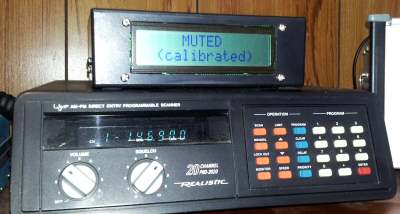
Front view showing muted state and that it is running in calibrated mode.
Introduction by Brian VK5VI
The majority of operation these days is on 2m and the preferred mode is predominantly FM or frequency modulation. In FM the frequency (or phase in older crystal-locked gear) is shifted about a centre frequency, the shift having been predetermined by general agreement and consistent with the design of the bandpass filters of the receiver to which it is communicating. Most amateur gear follows the design of previous commercial gear with a maximum deviation of +/- 5KHz. The shift to even narrower deviation has not followed that of commercial gear to date as there is little or no need to (so far).
Obviously there remains a need to measure the shift or deviation used. Most amateur gear purchased has been set in the factory and usually there is no need to alter it. But should you desire to alter the modulation the exercise to date has usually been a hit-or-miss affair, asking others for an on-air report, unless of course one has access to a service monitor.
With this little piece of test equipment accurate deviation measurements can be made once the unit has been properly calibrated.
The deviation meter consists of three parts:
receiver (an AOR 3000a scanner in my case)
audio amp/detector/meter driver board, and
display meter
The Receiver
This can be most any receiver suitable for +/- 5KHz deviation, but the demodulated output MUST be taken from the discriminator and NOT from the normal audio chain as the audio must be free of de-emphasis. In your receiver note the demod chip and take the audio straight from that point.
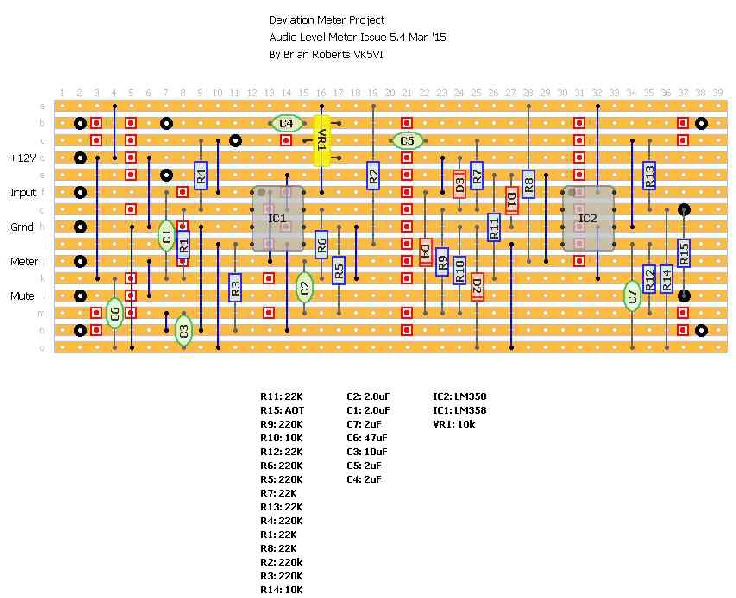
The Audio Board
This design was copied from some ex-commercial gear and is simply an audio amplifier and peak detector suitable for driving a 0-1 mA analog meter. It has an input level control to assist with calibration.
The design was made with DIY Layout Creator (freeware on the Net) using el-cheapo Veroboard. I saw no need to go to the trouble of making a PCB.
The Display Meter
I recycled an old analog meter and re-calibrated the scale to 0-6KHz using Meter program from James L. Tonne. This free version has a limit of 10 tries before it bombs out so be careful with your tries. Once the 10x tries has expired you cannot just remove the program and reinstall, it has smarts somewhere to note previous installs.
Just print your design on good-quality paper and use spray-on craft glue to attach to the meter face.
If the numbers do not align with the scale a work-around is to select Horizontal in the Label Design from the Plate Design page. This fault is with the way your printer interprets the data.
Calibration
The author has chosen to use a 0-6 KHz scale purely for convenience. Once the deviation meter has been assembled all that remains is to calibrate the meter. In the first instance the meter can be adjusted to read approximately 3KHz or half-scale with wide-band noise from the unmuted receiver. This should give a reading within 10% of a true calibration.
For proper calibration this should be checked against a service monitor. If this is not an option and you are in possession of an HF rig with a panoramic display then it is an easy task to inject a 1KHz tone to a (FM) radio and carefully watch for the first carrier null. This will give a deviation of 2.4KHz and all that is needed is to adjust the calibration pot to read 2.4KHz.
In Conclusion
I often use my deviation meter to monitor our local repeaters and note the vast differences in the average modulation levels of various stations. As well I use it to set the repeater audio linearity, that is the input to output level which should be unity.
But a word of caution about deviation. Many years ago, when FM was introduced, pre- and de- emphasis was invoked to improve the signal/noise ratio by boosting the audio at the transmitter by 6db/octave and of course a complimentary cut in the opposite direction at the receiver. While this may give some overall benefit it causes no end of problems when trying to adjust deviation to a suitable level. Setting deviation to a known level at one (audio) frequency will give double the deviation at twice the (audio) frequency.
Addendum
Since the inception of this project there have been some changes, the analogue meter has been replaced with a digital display (courtesy of John VK5DJ), a major change to the audio board with the addition of two more op amps, and a minor change to the peak detector circuit to improve audio linearity. These are noted as:
a unity gain op amp to isolate the circuit from the receiver to prevent disruption to the receiver mute circuit
a further unity gain op amp to allow inversion of the audio so that +/- deviation can be measured
C7 6n8 added across R15 to give some high-frequency boost to the peak detector to improve frequency response
track to be cut under R1 adjacent to C1. [not evident from the diagram]. Click diagram for better resolution download.
the meter is replaced with a fixed resistor, a typical value would be 1k0, sufficient to give 0-5v to the analog input of the PIC
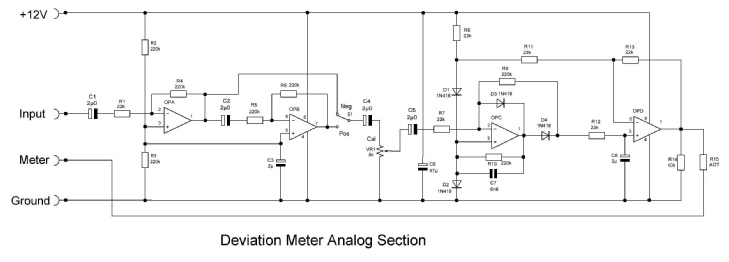
Resistor R15 above may require adjustment depending on meter. Start with 6k8.
A quality Version of the above layout is in the ZIP file accessible below or from downloads, as is a reverse view to facilitate work on the vero board.
The VK5DJ LCD version
Enables a moving graphic scale on the top line of a 2*16 LCD with a readout in kHz below.
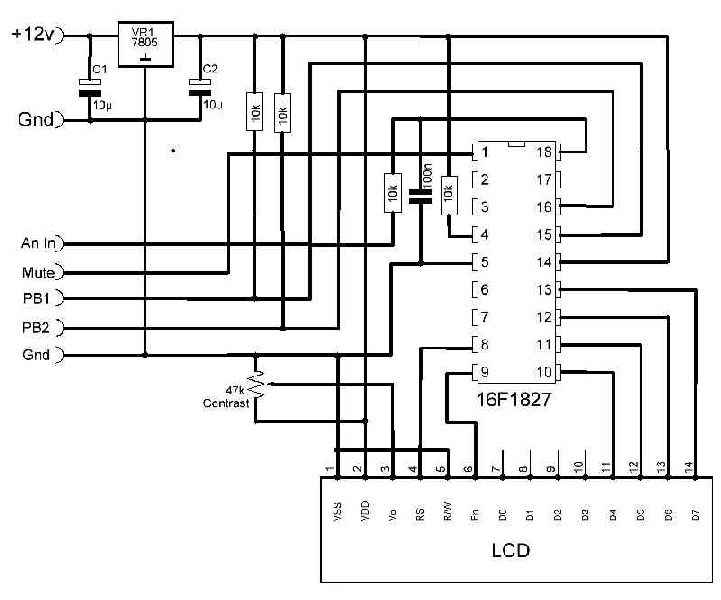
The LCD circuit takes its input from the meter connection on Brian’s board. This is connected to the A/D port on the 16F1827.
Strictly speaking there should be some protection of this pin with a zener as the voltage could potentially exceed the +5V permitted but providing the calibration pot on Brian’s board is adjusted from the bottom up the voltage will not exceed +5V and in any case there are protection diodes in the PIC so they should do their job in view of the series resistors.
How does it work from the Realistic Pro 2020?
By taking audio direct from the discriminator of the scanner the level of the audio is dependent on the deviation up to a certain limit. It seems that 6kHz is a reasonable design figure before non linearities creep in due to filters and discriminator adjustment. My scanner is a Realistic 2020 and the audio can be obtained from pin 9 of the LM3357 (IC101) which happens to be test point 105. Use shielded wire to a new DIN plug on the rear of the scanner. Earth the shielded wire at the end near the IC. Also run 12V from the scanner low voltage supply to the DIN plug. I have since included a Mute line from the 2020 and connected this to pin 1 of the 16F1827. The mute voltage change was quite small (0 to just over 1 volt) so I defined pin 1 as an analogue input and checked for a voltage exceeding 1V, if so the receiver was unmuted. Different receivers will behave differently.
When all is wired up adjust the pot according to Brian’s advice above. I choose 3kHz deviation because I have an accurate signal generator. That’s it.
Fine tuning the calibration
In South Australia we set deviation test levels with a 1kHz tone from a signal generator set for 3kHz deviation. When using the LCD module you can, if you wish, overcome slight non linearities in the readout by setting the device to calibrated mode. In my working system I plotted the errors in an EXCEL spreadsheet and then developed a formula to compensate. I included this formula in a subroutine accessed when calibrate mode is selected. Calibrate mode is selected by holding down the switch labelled PB1 on pin 16 for 1 sec until the message “Calibrated” or “Not Calibrated” appears. This switch alternates between the two modes and the mode is saved so that on repowering the device it starts as you left it. I had planned an individualised calibrate function for other people who might use this idea but not yet implemented it - at this stage my calibration is locked in via software. A one spot calibration for the Non Calibrated mode can be achieved by choosing the deviation to be used, feeding in the deviation desired and then adjusting the pot on the audio board to the required readout. Builders of this project will probably ignore the calibrated mode.
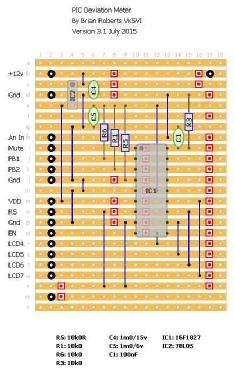
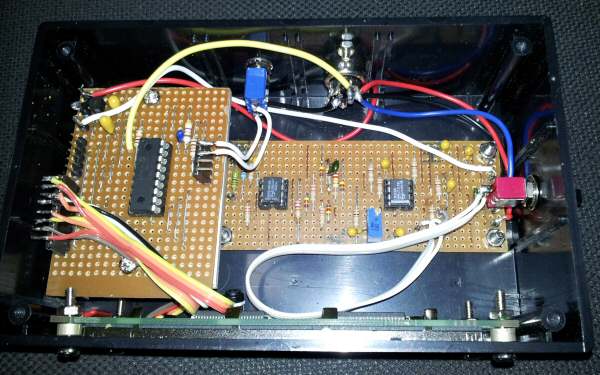
Left -Top view of Vero Board layout. In the ZIPPED file there is a full size image and a reversed image for drilling/isolating tracks. Regulator is a 78L05, current draw is just a few mA.
The contrast pot is wired on the back of the LCD and does not appear on the layout to the left.
| Repeater features |
| Solar version |
| 1750Hz decoder |
| Record and playback |
| Voice interface |
| Micor solution |
| Yagi Calculator |
| RD Contest logger |
| Moon Tracking |
| Orbitron interface |
| PRFCalc |
| TAIT programming |
| Proton Development Suite |
| Old crystals for radios |
| Compound interest |
| Yagi photos |
| Bird proofing |
| Bender |
| VK5DJ downloads |
| VK3UM downloads |
| Site map |